Creating a user-friendly platform.
LandLogic's platform needed an overhaul. It worked, but flows were clunky, difficult to understand and unintuitive. As Creative Director of LandLogic, I took on the project to update key flows, revise page design, and refine critical interactions. Of course, that meant I had to learn Figma and massively improve my UX/UI skills!
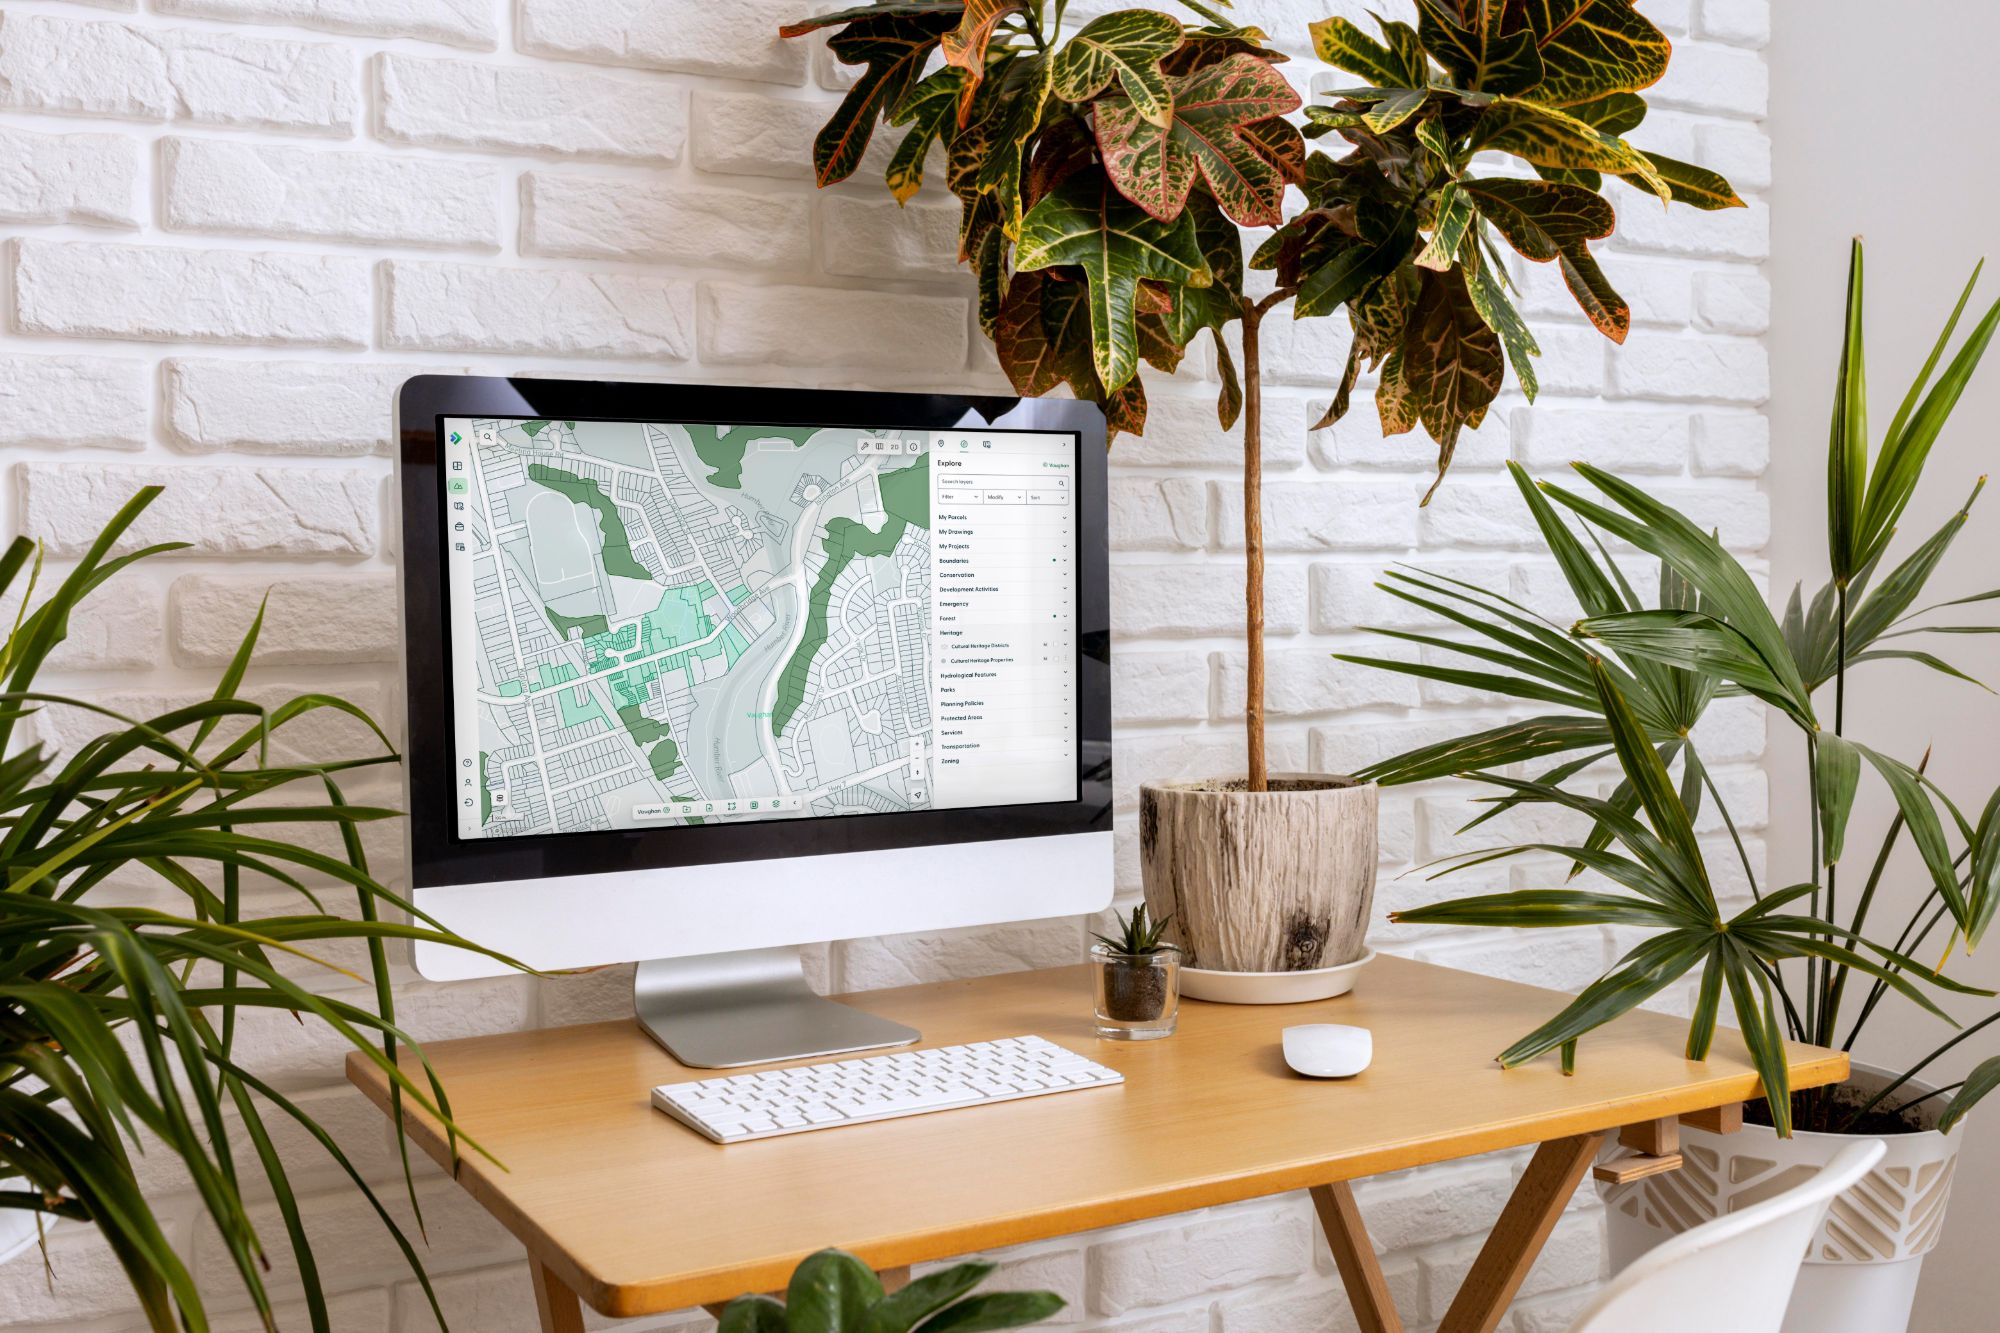
The platform was already active, but leadership felt it needed improvements to both the design and experience. I specialize in branding design, not UX/UI, but this was the perfect opportunity to hone my skills. This was the most detailed UX/UI project I had undertaken.
I started by getting a full understanding of the existing design, why decisions were made, where the weak spots were, and what the goals for the platform were.
I then studied the user research, user profiles and existing feedback on the platform. I worked very closely with leadership, development, and UX/UI teams to scope the project, set timelines and set expectations.
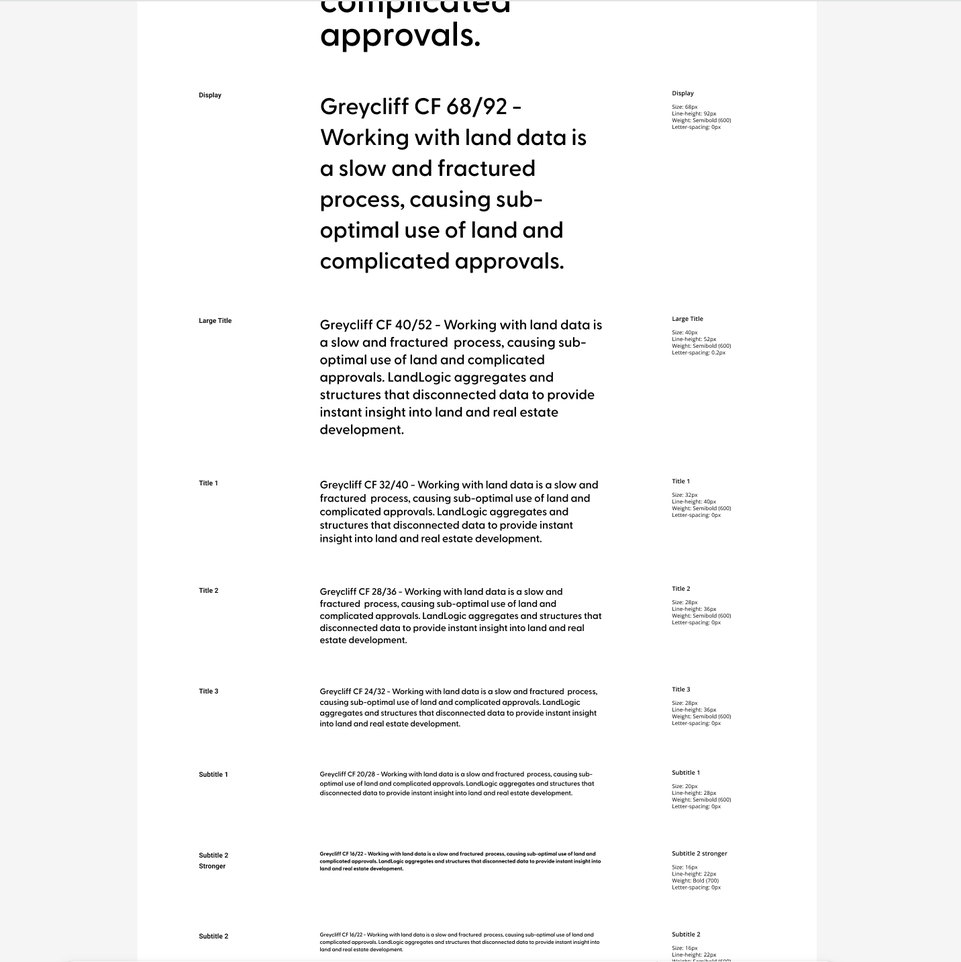
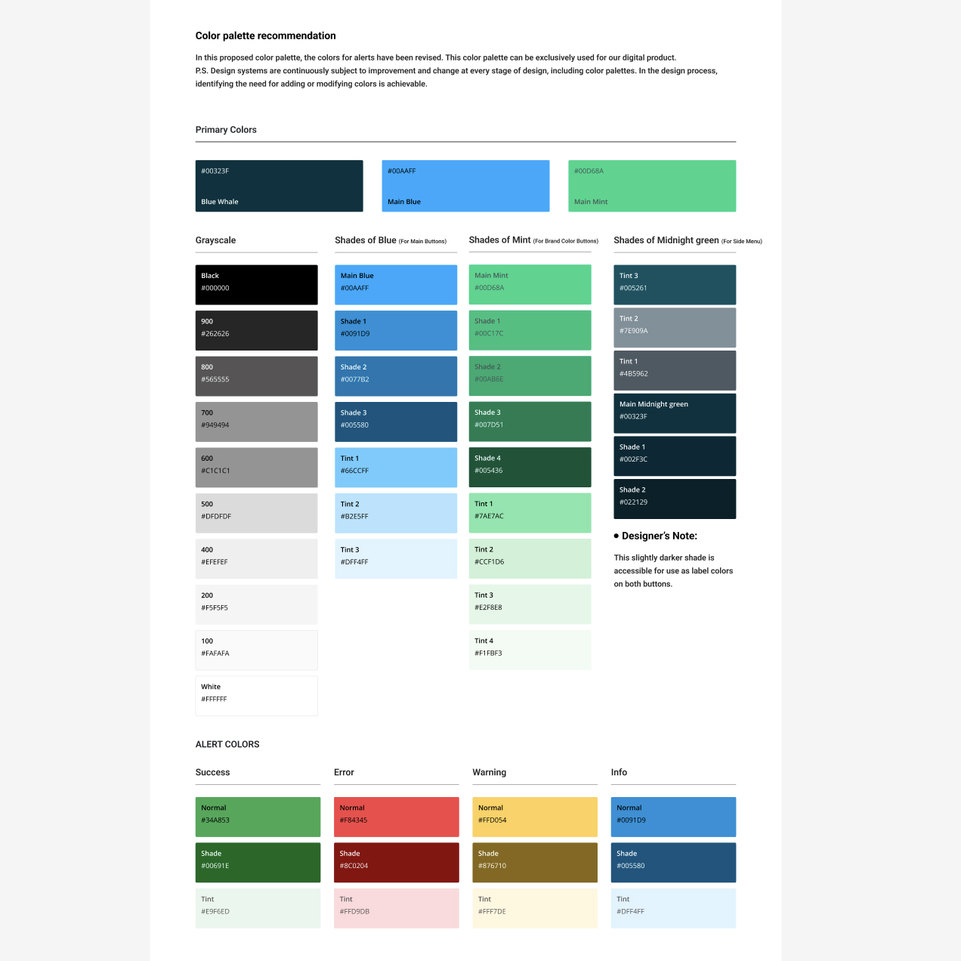
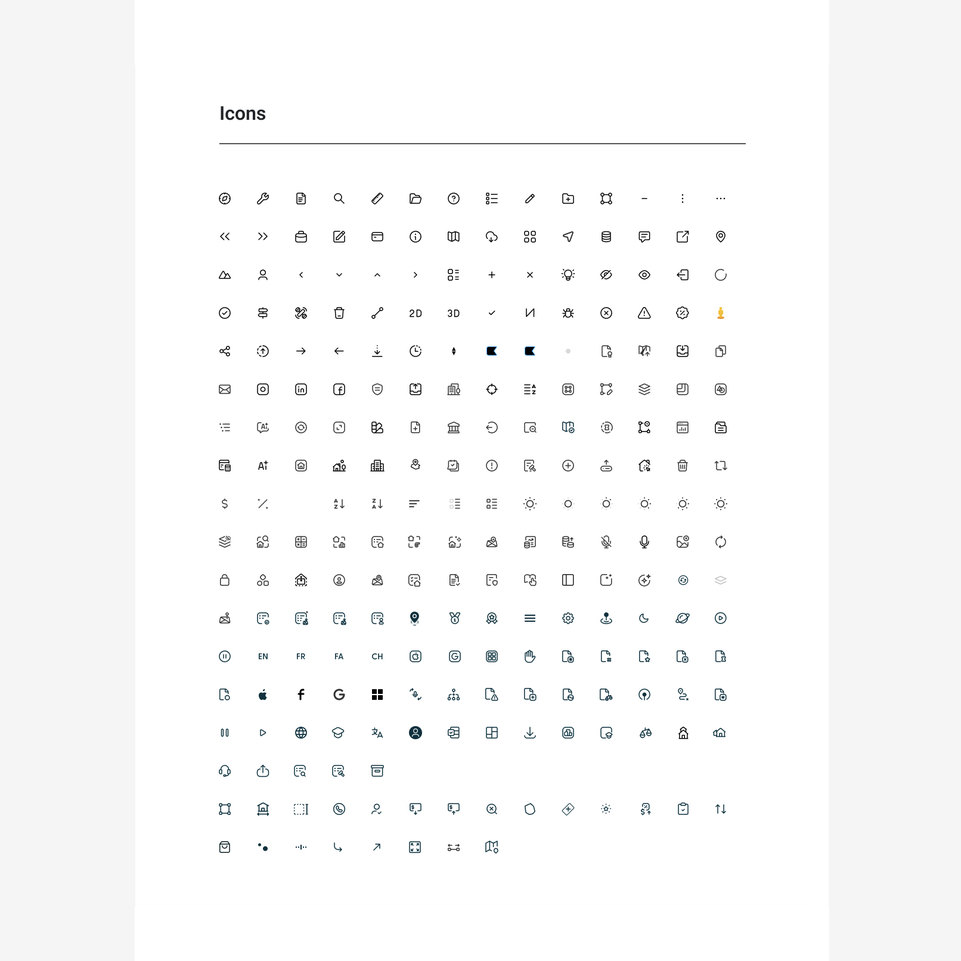
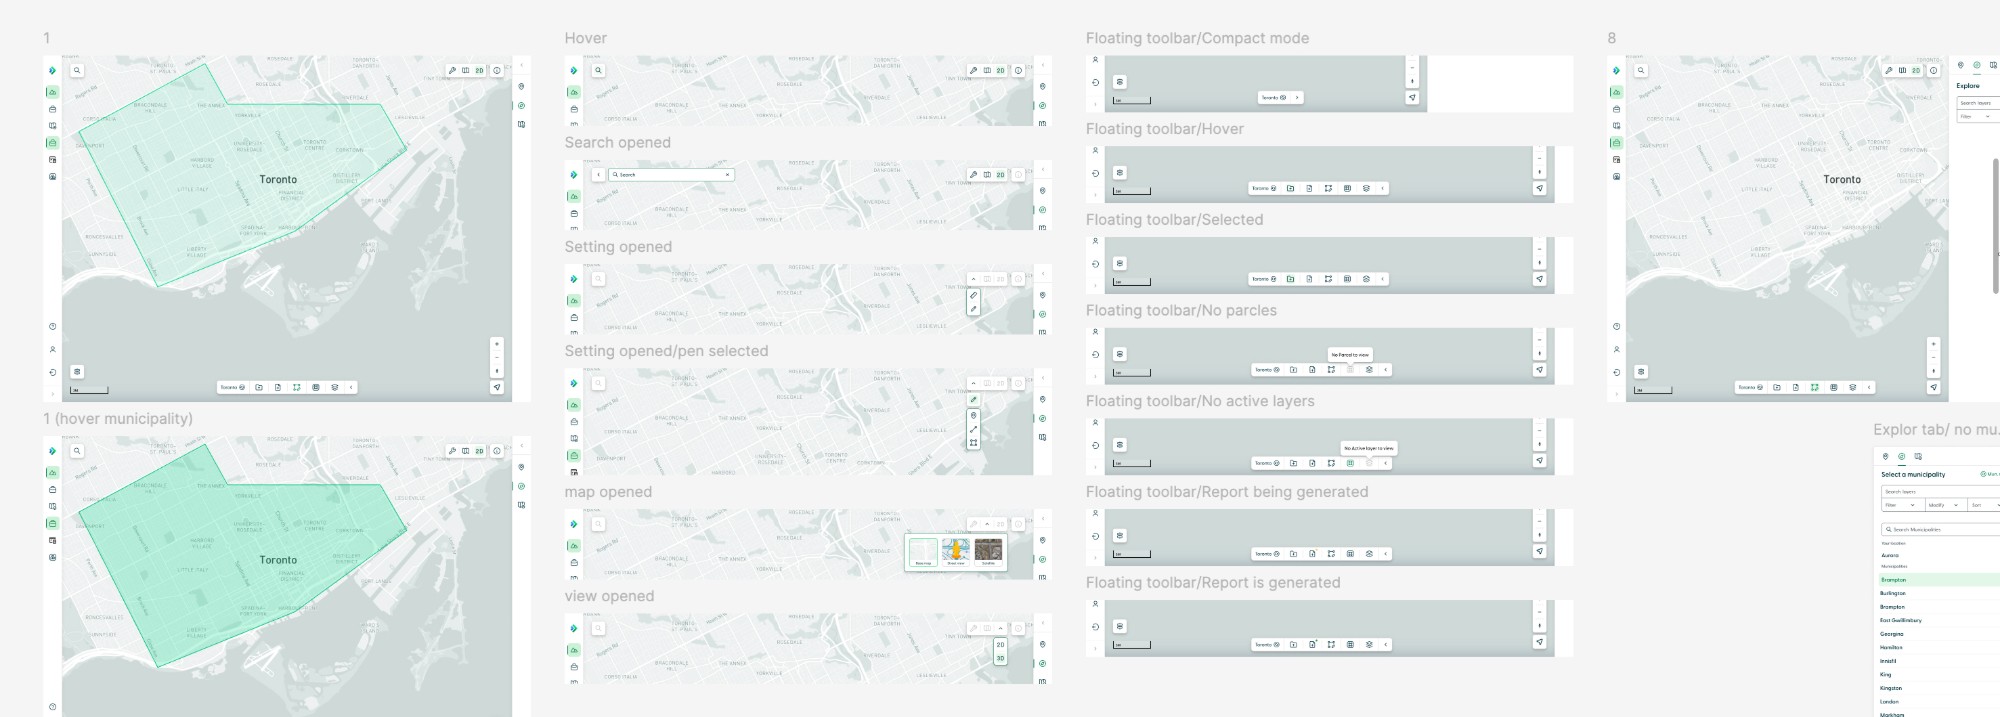
The overall objective was to simplify the user experience to make it easier to get to a certain goal, such as saving a project or downloading a report.
I worked on concepts, flows and updated UX and UI to pitch to the team. I ran brainstorms, testing workshops and feedback sessions to ensure we were all aligned on functionality and design. I also cleaned up the key elements of the design system like typography, colour, icons, accessibility, etc.
My experience in Figma was limited, so I put in some hefty self-teaching time. I didn't need to be a Figma expert, but had to make my files complete and consistent enough with proper formatting, styles, and components to be able to hand them over to the UX/UI and development teams successfully.
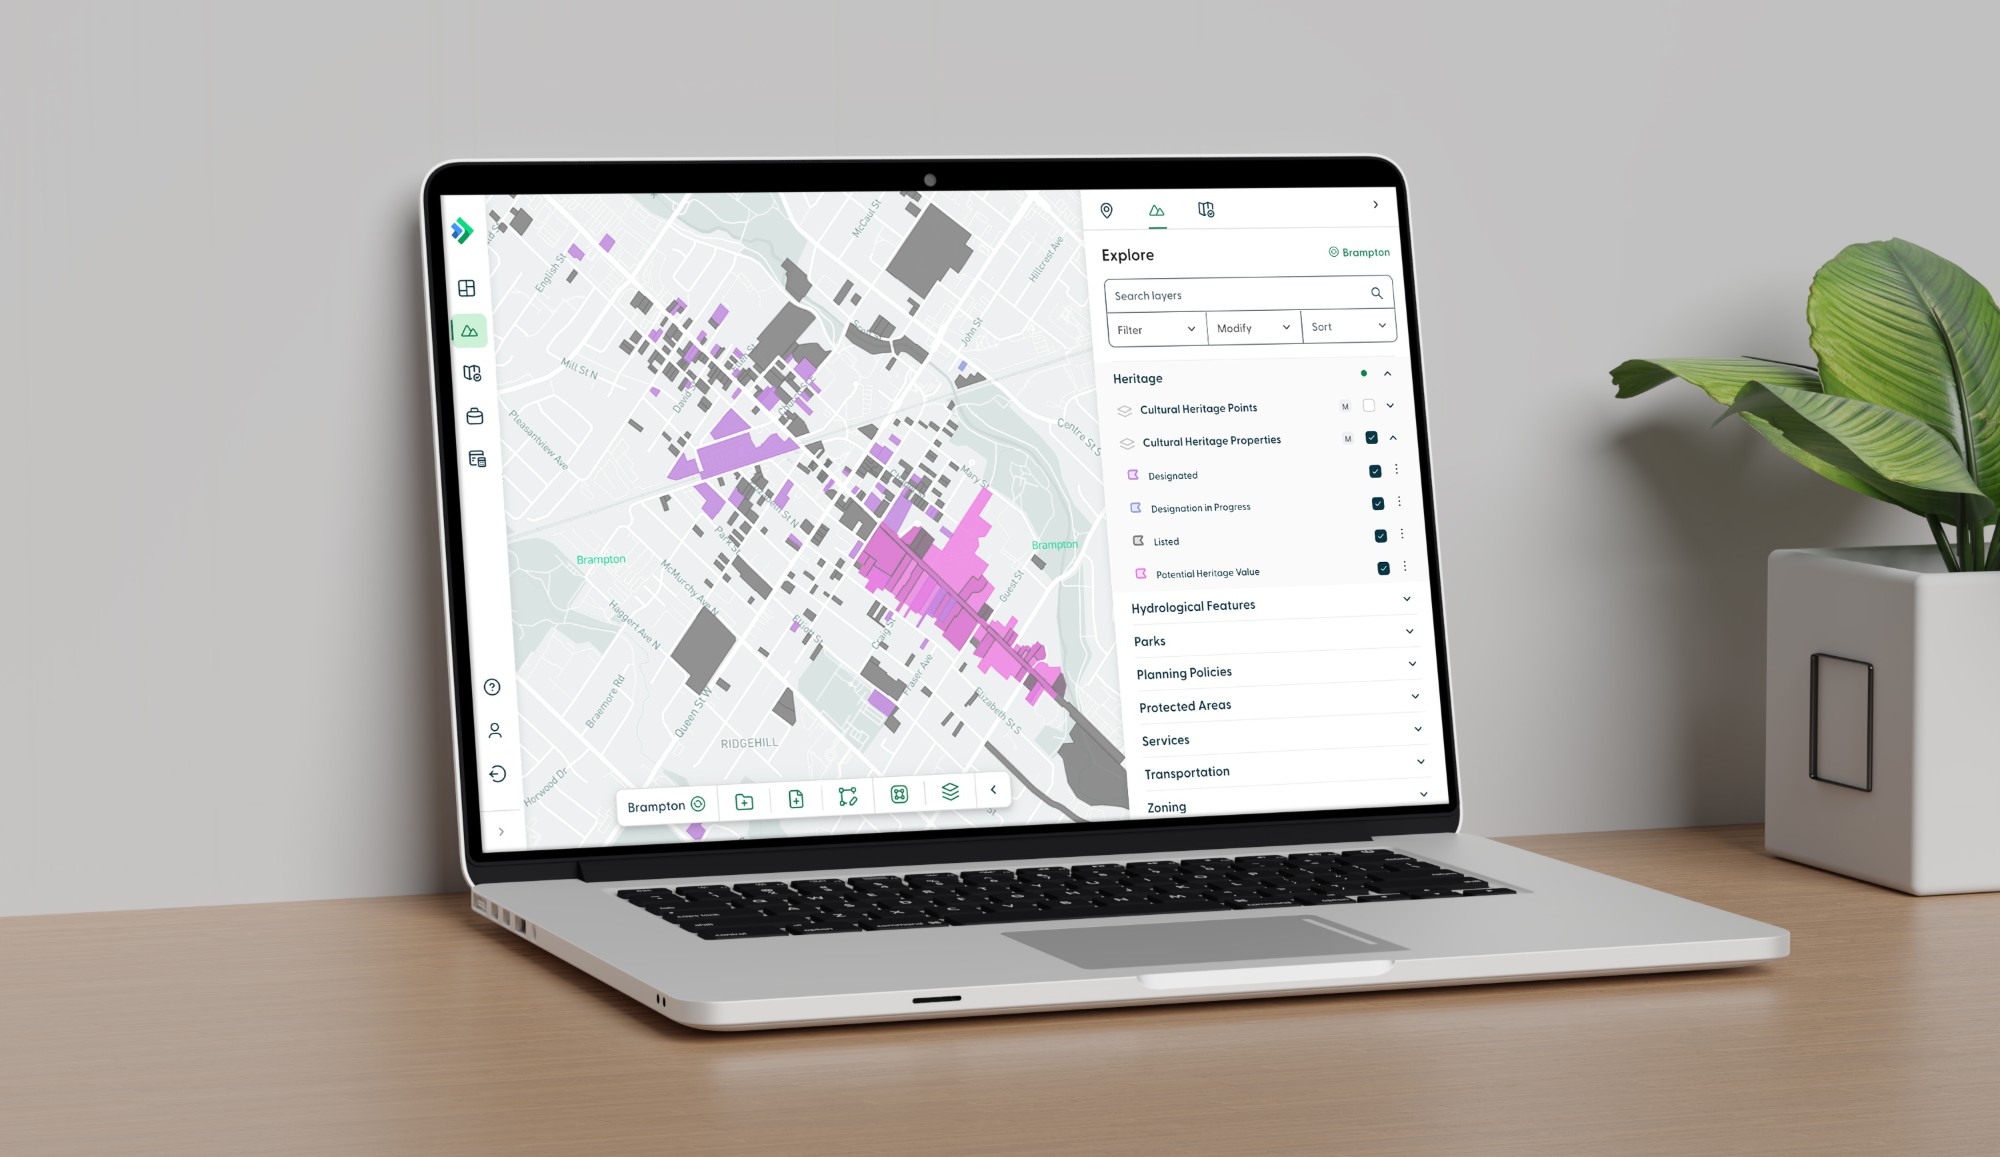
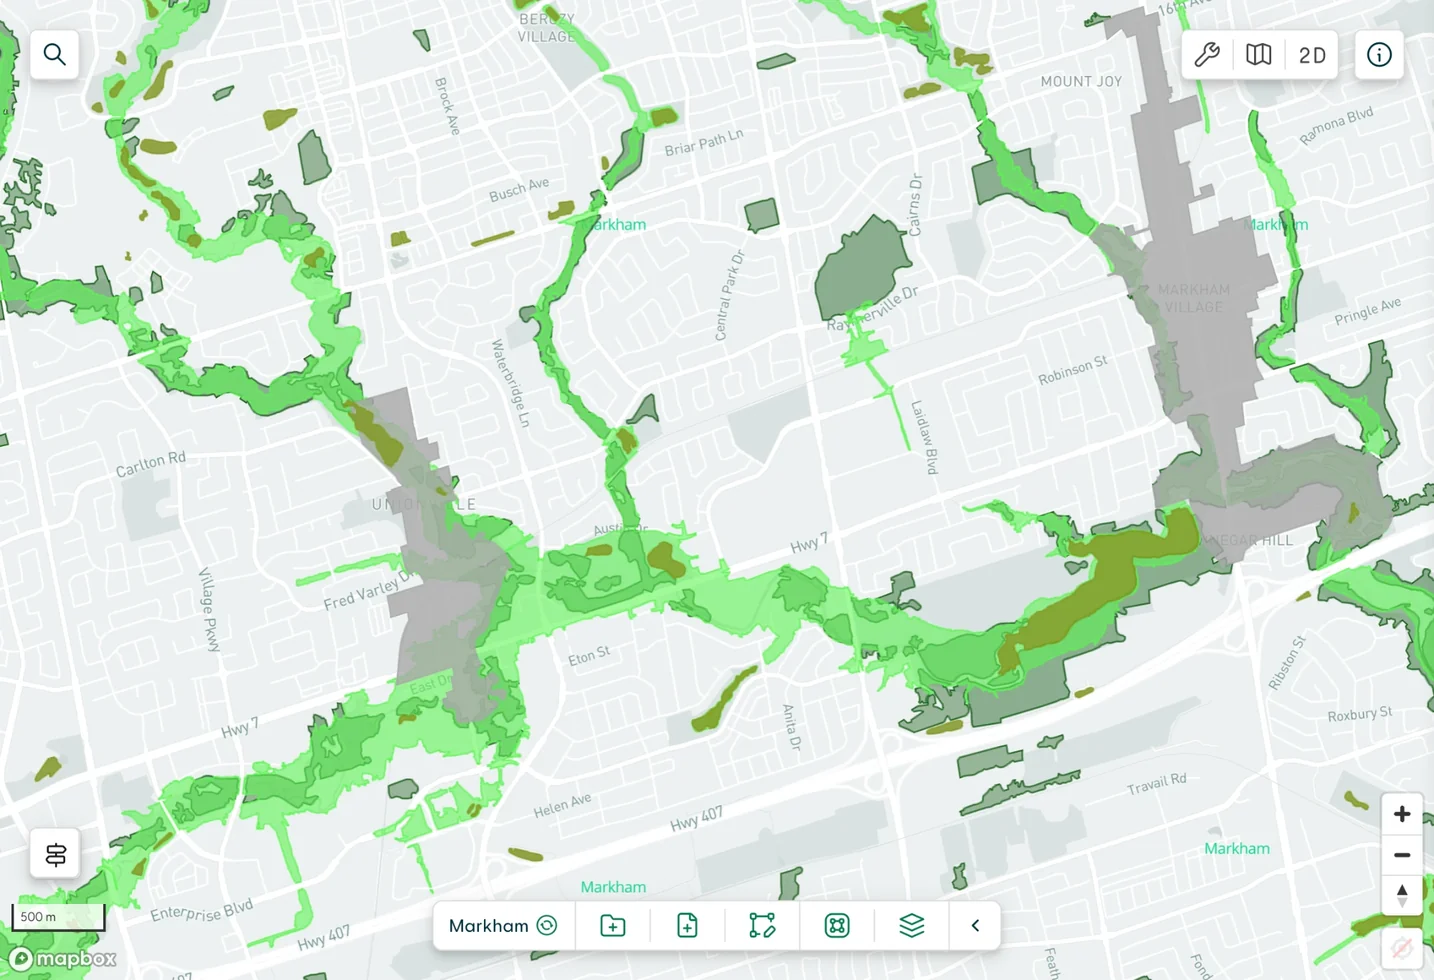
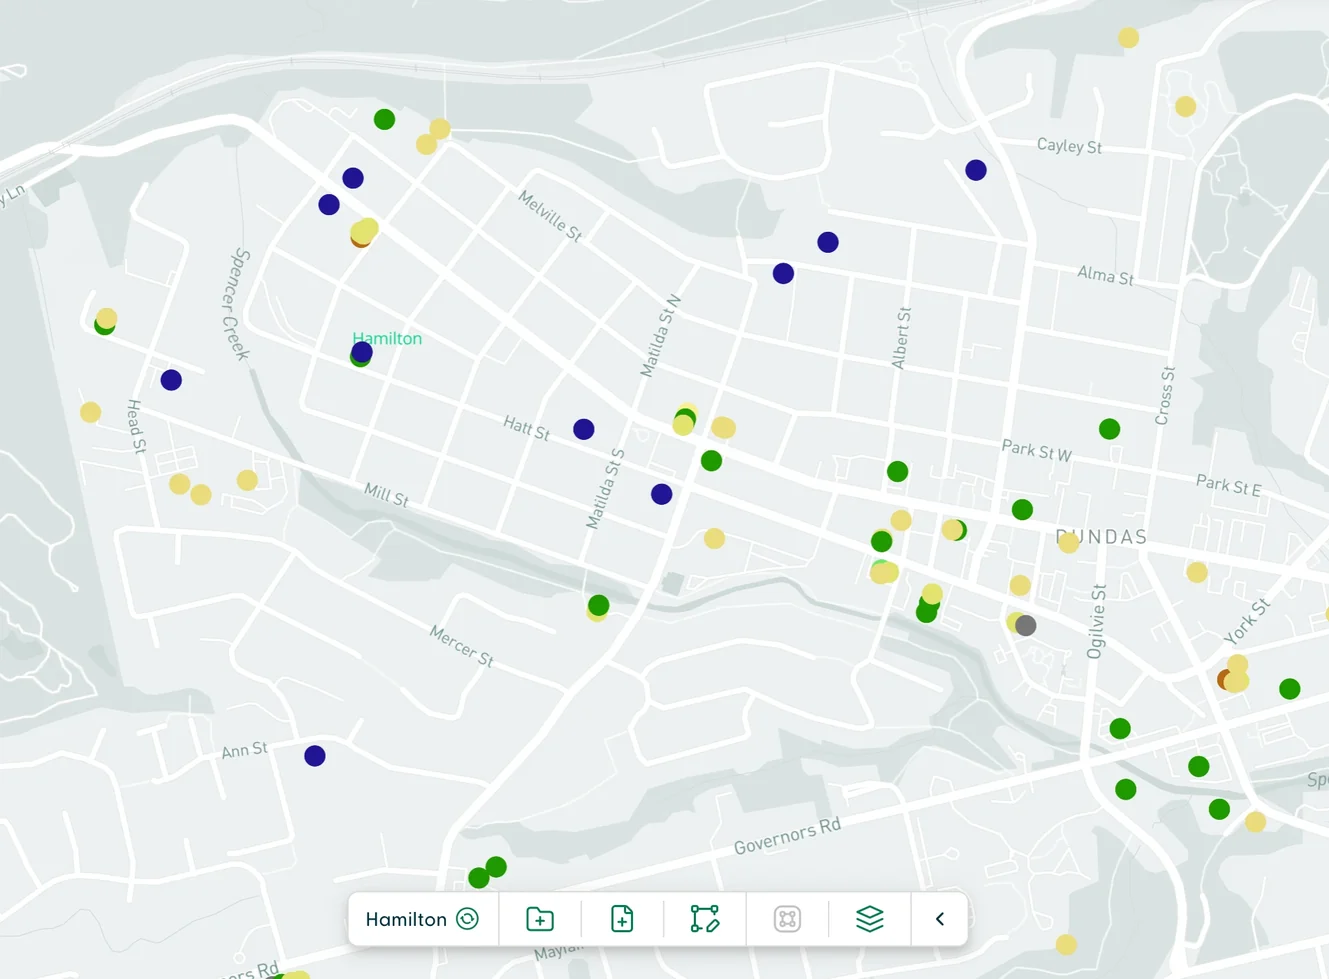
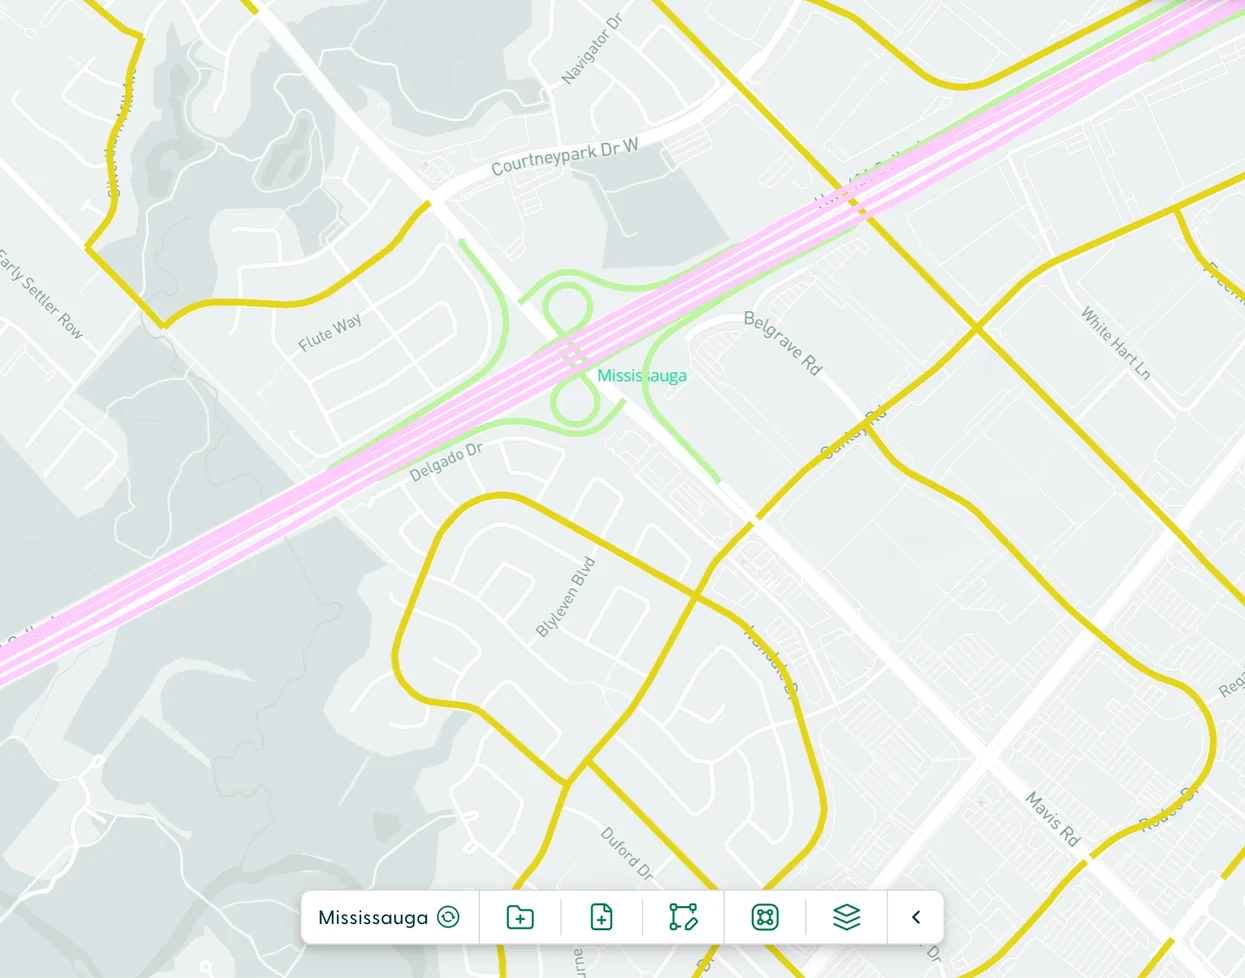
One of the biggest challenges when improving clarity and usability was working out how to visualize hundreds of different types of land and property data in one environment: colours, shapes, transparency, layering, and so on. It took a lot of testing and iterations to land on a workable model that would be easily understandable by users.
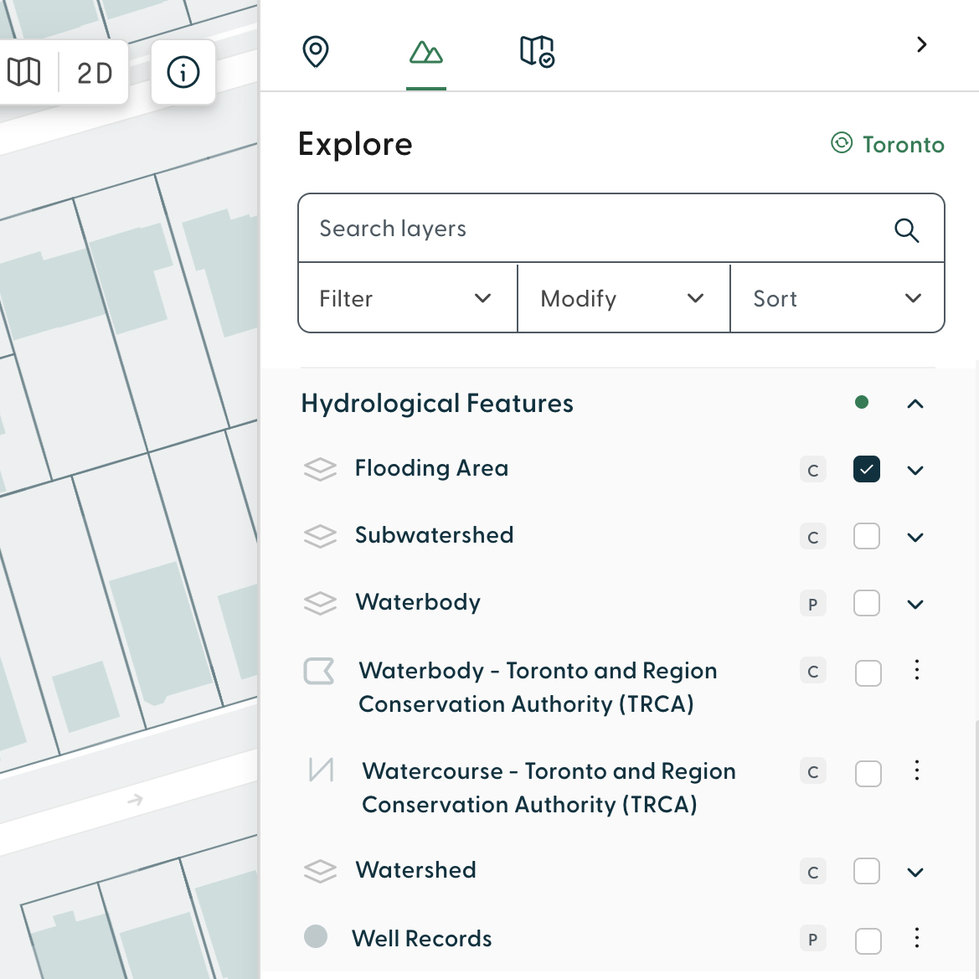
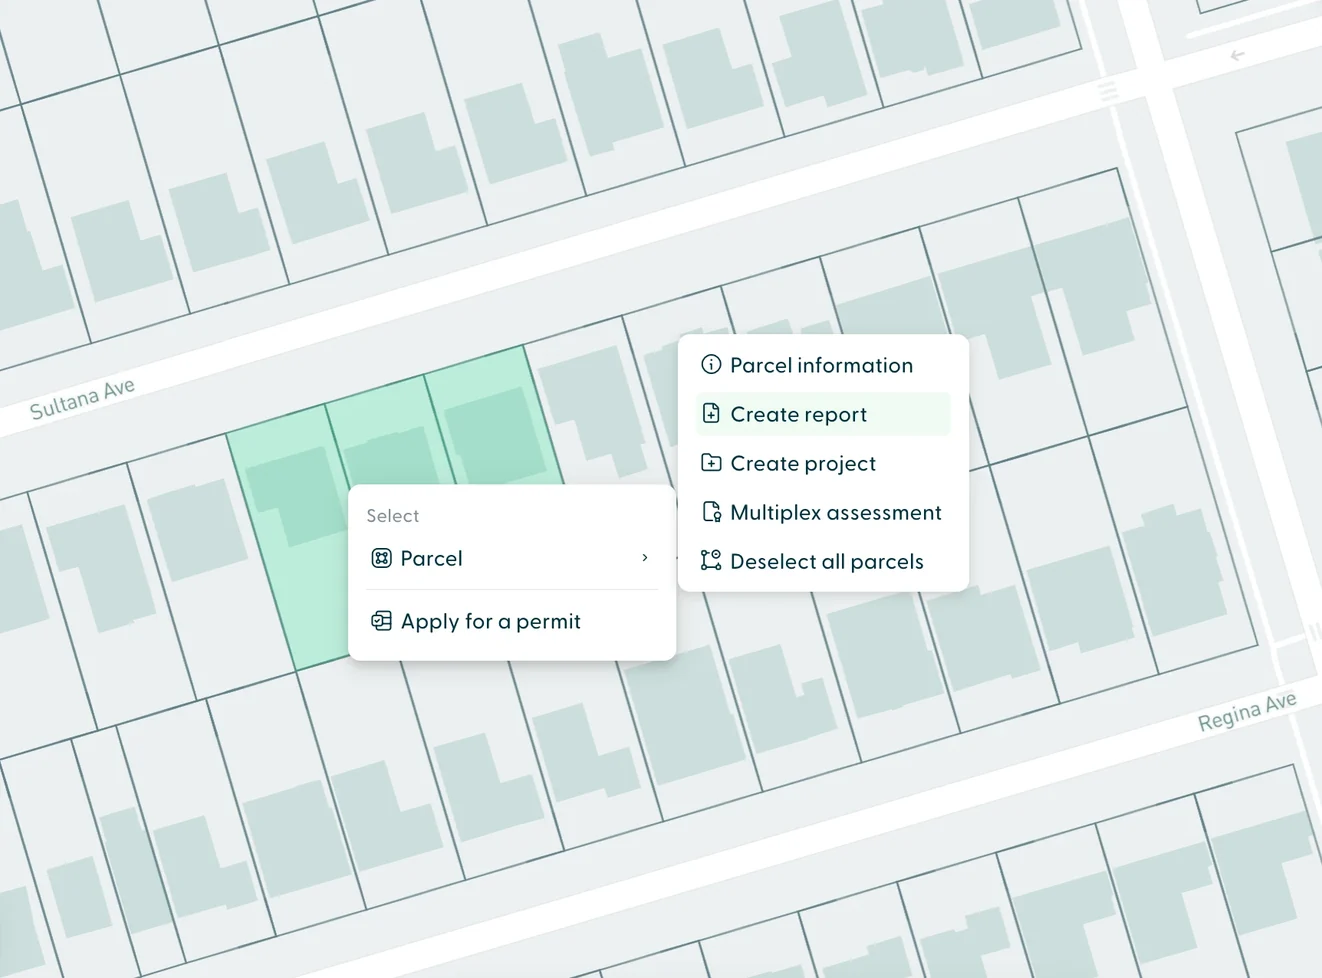
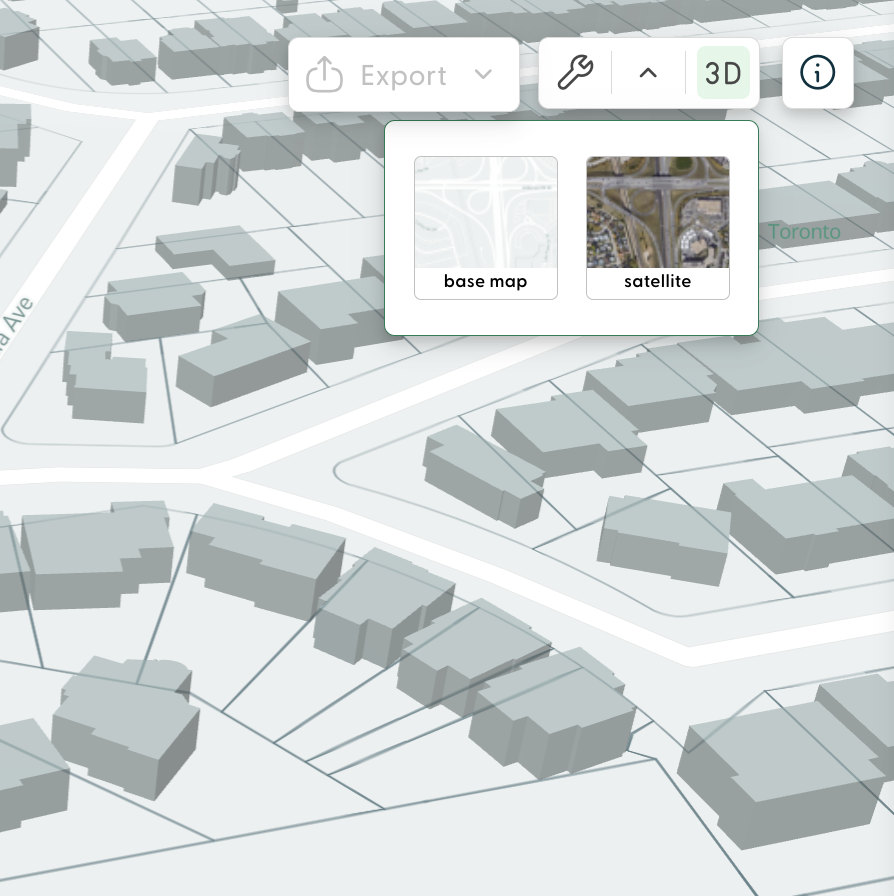
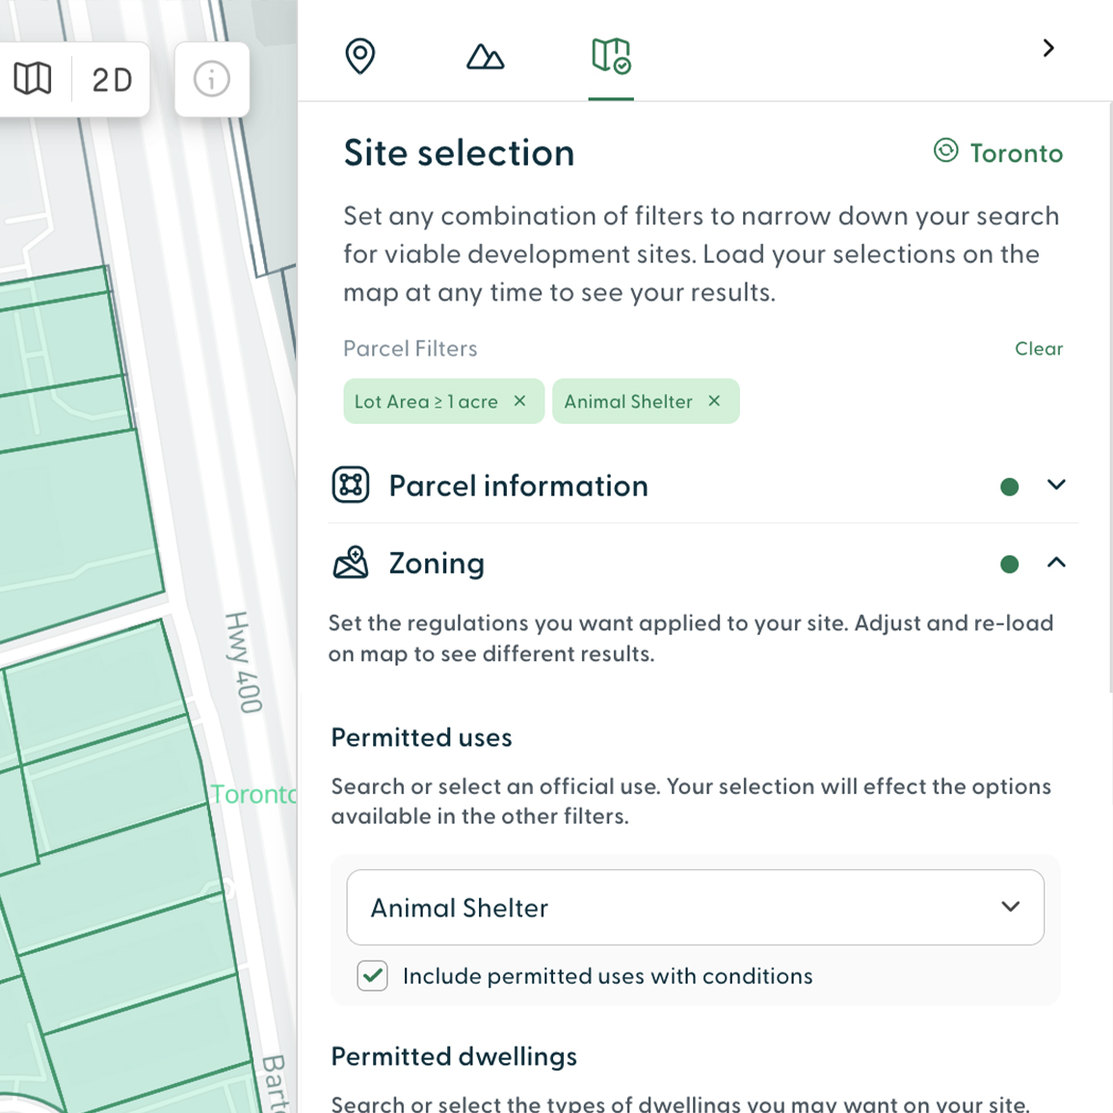
I examined how users could get to a defined goal in the simplest way, with the fewest clicks. This could involve satellite view, 3D extrusions, interactive measuring, saving projects, and more.
I researched competitor flows to establish best practices. I then iterated and presented options to the team. We tested with users who had used the platform before, and those who hadn't. We settled on very intuitive options that felt the most natural and familiar.
My role then transitioned from execution to guidance, and I worked with development and the UX/UI team while they rolled out the rest of the platform based on this new direction. We continued to monitor user interactions to keep improving the platform over time.